Struggling with slow dashboards in Tableau? Learn the difference between Live and Extract connections—and which one can boost speed, access, and insights.
Ever watched a colleague's dashboard load in seconds while yours sits there spinning? The culprit might not be your data or design—it's probably your connection type. Understanding Tableau data sources and how they impact performance is crucial for effective data visualization and analysis.
Here's what's happening: Tableau defaults to live connections with your data source. Every time you open a visualization, Tableau fires fresh queries straight to your database. Sure, live connections keep your insights current, but they're completely dependent on your source system's performance.
A Tableau data extract is different. It's a snapshot of data stored locally. Think of it like this: live connections are like streaming a movie every time you want to watch it, while data extracts are like downloading the movie once and watching it whenever you want.
The choice between these two data source types goes beyond technical specs. It affects user experience, data freshness, and even where you can access your visualizations.
Notice sluggish performance when applying filters or running complex calculations? Wondering if you're making the right trade-offs between real-time data and actual usability?
We at Darwin, have watched teams turn painfully slow dashboards into lightning-fast tools just by switching connection types. Others stick with live connections for mission-critical monitoring where every second counts. The right choice depends on what you actually need from your data analysis.
Want to know which connection type will make your dashboard faster? Let's break it down.
The impact of visualisation is not the expected one. When people say ‘It’s visualisation’ it is almost like they are picturing a chart that will enable them to visualise information in amazing graphical ways that they have never seen before. But that is not the point. Visualisation is the vehicle for making it easy for a human being to ask questions of data.
— Christian Chabot, Chairman, Co-founder of Tableau,
Click "Connect Live" in Tableau and you create a direct connection between your visualization and the source database. Nothing gets stored in Tableau itself. Every dashboard interaction triggers SQL queries that get fired straight to your data source.
Real-time dashboards can slow down by up to 65% under network strain. Need to maintain real-time access without sacrificing speed?


Open a live-connected dashboard or change a filter, and Tableau immediately creates and dispatches a query to your database. The database processes the request, returns results, and Tableau displays them in your visualization. Here's the thing: Tableau isn't a streaming tool—it's query-based. Data updates only when triggered by specific actions like opening views, changing filters, or manually hitting F5.
Tableau also maintains a cache of recently queried data. Sometimes your interaction pulls from this cache instead of sending a new database query, which can give you slightly outdated information. Want guaranteed fresh data? Hit that F5 key. It forces Tableau to dump its cache and request current information from the source.
Live data connections have a catch: your dashboard's responsiveness depends entirely on your data source's speed and network conditions. Slow database equals slow visualizations. Period. Every user interaction also creates database load, potentially affecting performance across your entire system.
Query execution path matters too. Ideally, your database optimizer filters data first, then joins tables. But if it joins before filtering, query performance can tank as data volume expands exponentially. This explains why identical dashboards perform differently depending on connection type.
1 in 4 organizations relies on real-time dashboards for mission-critical operations. Are you one of them?
Let Darwin assess if your setup supports high-stakes analytics.
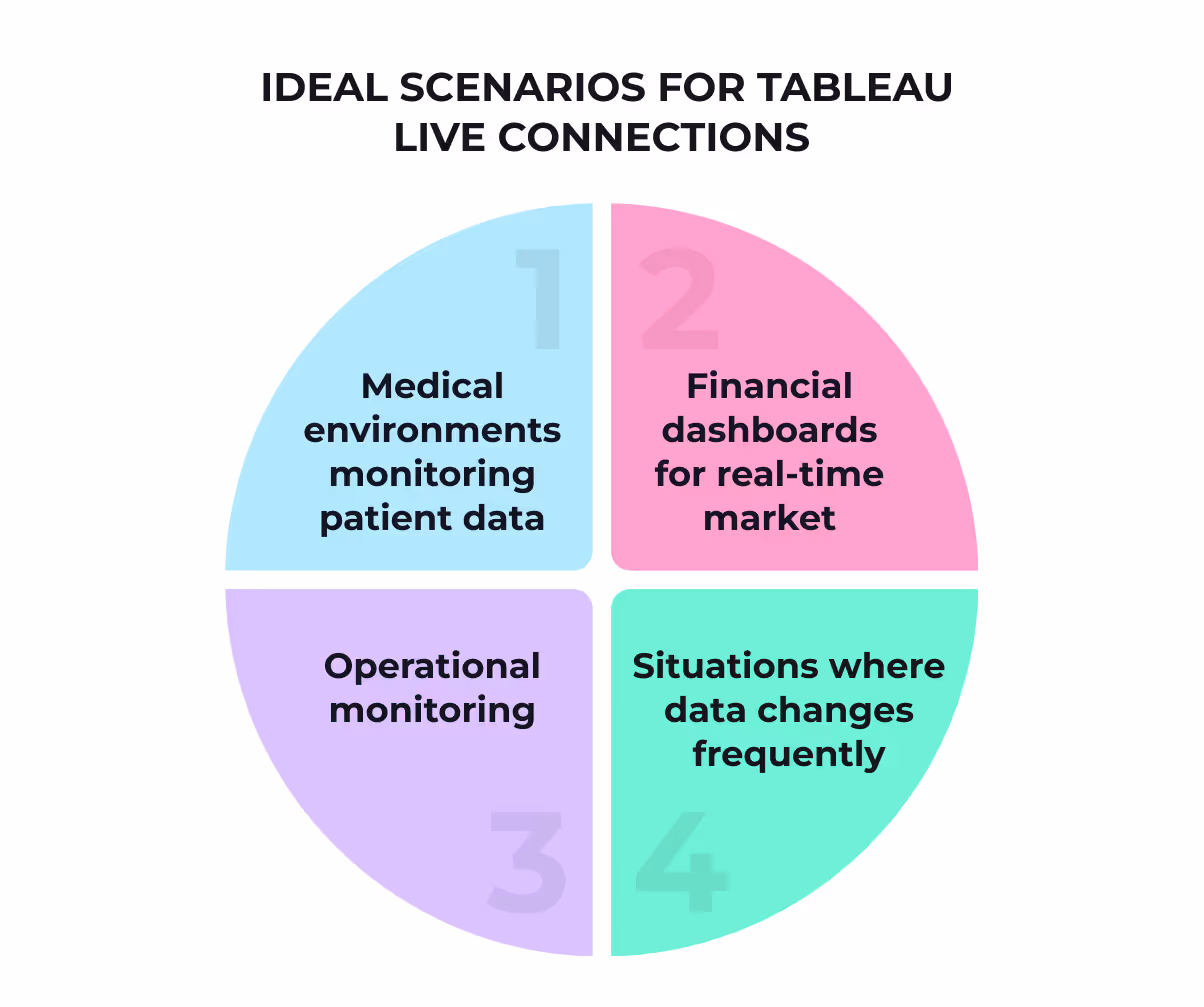
Despite these challenges, live connections excel in specific scenarios:
Live connections guarantee you're seeing the latest information available in your database. The trade-off? Potential performance hits. They're perfect when data currency matters more than dashboard speed, especially for real-time analytics.
Tableau data extracts are high-performance, compressed snapshots of your data. While live connections query your database directly, extracts create a local copy that Tableau has optimized specifically for visualization speed.
Extracts use columnar storage—they store column values together rather than row values. This cuts down the input/output required when accessing and aggregating values in a column. The real magic happens because extracts are memory-mapped files. When Tableau requests data, it loads directly into memory without needing to decompress or process the file first.
Tableau originally used the .tde format, but since 2018, the newer .hyper format became standard. This wasn't just a rename—Hyper is Tableau's in-memory Data Engine technology built specifically for fast data ingestion and analytical query processing on large datasets.
Want to really supercharge your extract's performance? When creating an extract, you can select "aggregate data for visible dimensions." This option pre-calculates aggregations, making them nearly instantaneous in your visualization. You'll notice this most with complex calculations—string calculations are significantly slower than numeric ones.
File size reduction is another win. Aggregated extracts contain only the summary data needed for your visualizations, not all the underlying row-level details. You can roll up aggregations to specific date levels (month, quarter, year), shrinking extract size even further.
As an industry, we need to flip the emphasis from technical training to using data in a business context.
— Cindi Howson, Chief Data Strategy Officer at ThoughtSpot
The most practical advantage of data extracts? Portability. Since extracts create a local copy of your data, you can work entirely offline once they're generated. Perfect for presentations, travel, or situations where database access is unreliable.
For sharing, extracts can be bundled with visualizations in packaged workbooks or published as standalone data sources on Tableau Server. Sharing via Tableau Server is more efficient than using network folders—it keeps extract processing on the server rather than across the network.
One heads-up: .tde files are being phased out. 2024.2 will be the last Tableau Desktop version supporting them, with .hyper format becoming the only option moving forward.
Creating an extract is just the beginning. You need to optimize it to really see performance improvements. The way you configure your extract can make or break both its size and speed.
First step after deciding on extracts? Apply extract filters to limit how much data gets pulled in. This keeps your extract focused and lean.
Do you actually need those historical records from five years ago? What about that region your company stopped servicing two years back? Probably not.
Here's a pro tip: hide any fields you don't need in your visualizations before creating your extract. These hidden fields won't be included in the extract file, making it considerably smaller. Want a quick way to trim the fat? Click the "Hide All Unused Fields" button in Tableau Desktop to automatically exclude fields that aren't actively being used in your visualizations.
Full extract refreshes replace all rows every time. With large datasets, this gets painful fast.
Incremental refreshes append only new rows to an existing extract. This approach runs much faster because it processes only data added since the last refresh. Smart, right?
To set up an incremental refresh, you'll need to select a field that identifies new rows—typically a date field or unique ID that increases over time. But here's the catch: incremental refreshes don't account for updated records, only newly added ones.
The solution? Schedule occasional full refreshes (maybe weekly) alongside daily incremental refreshes. This gives you a good balance.
Tableau offers a powerful option called "Aggregate data for visible dimensions" that consolidates rows in your extract. This feature creates pre-aggregated summaries rather than storing every individual record, substantially reducing extract size.
When enabled, Tableau looks at all dimensions to find duplicates, aggregating only where dimension values are identical. You can even roll up dates to specific levels (year, month, quarter) for further optimization. Bonus: this option automatically includes a count of rows, enabling average calculations if needed.
But be careful with aggregation when using non-additive calculations like COUNTD (distinct count) function. For these operations, Tableau must include all unique members of the base field in the extract, potentially increasing size.
The bottom line? A little optimization goes a long way toward faster dashboards.
.avif)
According Forrester’s 2023 report, 77% of security decision-makers reported experiencing at least one data breach in the preceding year.
Your connection choice affects more than just speed—it changes how you control data access too.
Data security isn't an afterthought. It's a fundamental part of how you architect your Tableau environment, especially when dealing with sensitive data.
Here's something that trips up most teams: Tableau permissions aren't the same as database permissions. Having a Tableau account doesn't automatically grant access to your data sources.
Site roles determine who can do what—administrators, content creators, or viewers. But even with the right role, users still need explicit permission to connect to your published data sources.
When you publish, you decide the permission structure. Default project permissions or custom access rules. View capabilities or full Connect privileges. You control who sees what data and how they interact with it.
This layered approach creates security depth without making things overly complex. Each layer serves a specific purpose.
Getting Tableau Cloud to talk to your private network data requires either Bridge or Data Connect. Both solve the same problem with different approaches:
Tableau Bridge runs as client software inside your network. You install it, manage it, and maintain it. It creates secure WebSocket connections using standard outbound ports 80 and 443. All traffic gets TLS encryption.
Data Connect is the paid enterprise option where Tableau handles the heavy lifting. You provide compute resources, they manage the Kubernetes cluster. Your data never touches the public internet, and you skip the VPN complexity.
Bridge gives you control. Data Connect gives you convenience. Pick based on your team's priorities and your on-premise database setup.
Authentication matters more than most people realize. When publishing workbooks, you've got three main options:
Embedded credentials let users access data even without explicit View or Connect permissions. Prompt users requires both Tableau access and database credentials.
Since February 2022, Tableau Online requires multi-factor authentication. You can satisfy this through SSO with MFA or TableauID credentials plus additional verification.
The choice you make here directly impacts user experience. Choose wisely.
Choosing between Tableau extracts and live connections isn’t just a technical performance tweak — it’s a strategic decision. BI platforms today are expected to empower action, not just exploration.
Data extracts win on speed, especially with large datasets and complex calculations. Live connections win on freshness, particularly when real-time data drives critical decisions.
What matters? Your specific situation.
Building dashboards for financial traders who need up-to-the-minute market data? Live connections make sense despite the performance hit. Creating quarterly sales reports where 24-hour-old data works fine? Extracts will give you dramatically faster load times and much happier users.
The beauty of Tableau is you can test both approaches with your actual data. Start with an extract and see if the refresh schedule meets your needs. If not, switch to live and evaluate whether the performance trade-off is worth it.
Security adds another layer to consider. Credential handling works differently between connection types, and your IT team probably has strong opinions about how data moves between systems.
Still unsure which path to take? Contact Darwin for a custom Tableau session tailored to your specific data environment and requirements. Their expertise can help cut through the confusion and establish the perfect connection strategy for your organization.
The "right" connection choice comes down to balancing three factors: performance needs, data freshness requirements, and security constraints. Find that sweet spot, and your dashboards won't just run faster—they'll deliver more value to everyone who uses them.
Q1. What are the main differences between live connections and extracts in Tableau? Live connections query the data source directly in real-time, while extracts create a local snapshot of the data. Live connections provide up-to-date information but may be slower, whereas extracts offer faster performance but with potentially less current data.
Q2. How can I improve the performance of my Tableau dashboard? To boost dashboard speed, consider using extracts instead of live connections for large datasets, optimize calculations by moving them to the backend where possible, reduce calculation granularity, minimize the number of referenced dimensions, and avoid nested calculations.
Q3. When should I use an extract instead of a live connection in Tableau? Use an extract when working with large datasets, especially text or Excel files, to improve performance and access more functionality. Extracts are also beneficial when developing dashboards to reduce load times during the creation process.
Q4. How do I create and optimize a Tableau extract for better performance? To create an optimized extract, apply filters to limit unnecessary data, hide unused fields before extraction, use incremental refreshes for large datasets, and consider aggregating data for visible dimensions to reduce extract size and improve query speed.
Q5. What security considerations should I keep in mind when choosing between live connections and extracts? For live connections, consider network and database dependencies, as well as credential handling. With extracts, focus on access control for published data sources, decide between Tableau Bridge or Data Connect for secure on-premises access, and carefully manage credential embedding and user authentication options.
Let’s find your balance of speed, security, and data freshness.Book a free 30-minute Tableau strategy session with Darwin now.
Book a call


.avif)