
SegmentStream vs GA4 vs Adobe Analytics + 6 More: B2B Attribution & Analytics Infrastructure Implementation Guide.
Quick Answer:
The best marketing tools in 2026 include SegmentStream, Google Analytics 4, Adobe Analytics, Funnel, Supermetrics, Triple Whale, Northbeam, Measured, and Rockerbox.
Each platform supports a distinct analytical approach, including multi-touch attribution, marketing mix modeling, incrementality testing, or structured integration pipelines.
Selection depends on company size, media spend, infrastructure maturity, and whether the priority is attribution accuracy, modeling depth, privacy compliance, or integration architecture. These platforms represent the core marketing measurement systems used by growth-stage and enterprise teams in 2026.
This article reviews nine platforms experts use in 2026:
Each section covers capabilities, pricing structure, strengths, limitations, and ideal use cases.
Marketing measurement has shifted from platform-reported metrics to system-level attribution, experimentation, and modeled performance evaluation.
Teams operate separate dashboards for web analytics, attribution platforms for cross-channel tracking, and channel-specific reporting in ad platforms. The constraint today is fragmentation. Data lives across disconnected systems, definitions differ across teams, and performance visibility breaks down between acquisition, product, and revenue layers.
This guide reviews the tools companies use to understand what drives revenue and how marketing performance connects to business results.
Darwin implements systems that connect attribution, analytics, and revenue reporting for B2B teams.

SegmentStream is a marketing analytics platform designed for revenue attribution and incrementality analysis in multi-channel environments.
It is used by ecommerce, DTC, B2B, and enterprise teams that require alignment between ad platform metrics and actual revenue outcomes. The platform focuses on full-funnel measurement across complex customer journeys where single-platform reporting creates discrepancies.
The platform supports advanced multi-touch attribution models that distribute credit across touchpoints throughout the customer lifecycle. This improves visibility into channel interaction across acquisition, consideration, and conversion stages.
Incrementality analysis is embedded into the measurement framework. The system evaluates whether specific channels contribute incremental revenue beyond baseline demand, supporting more accurate budget allocation decisions.
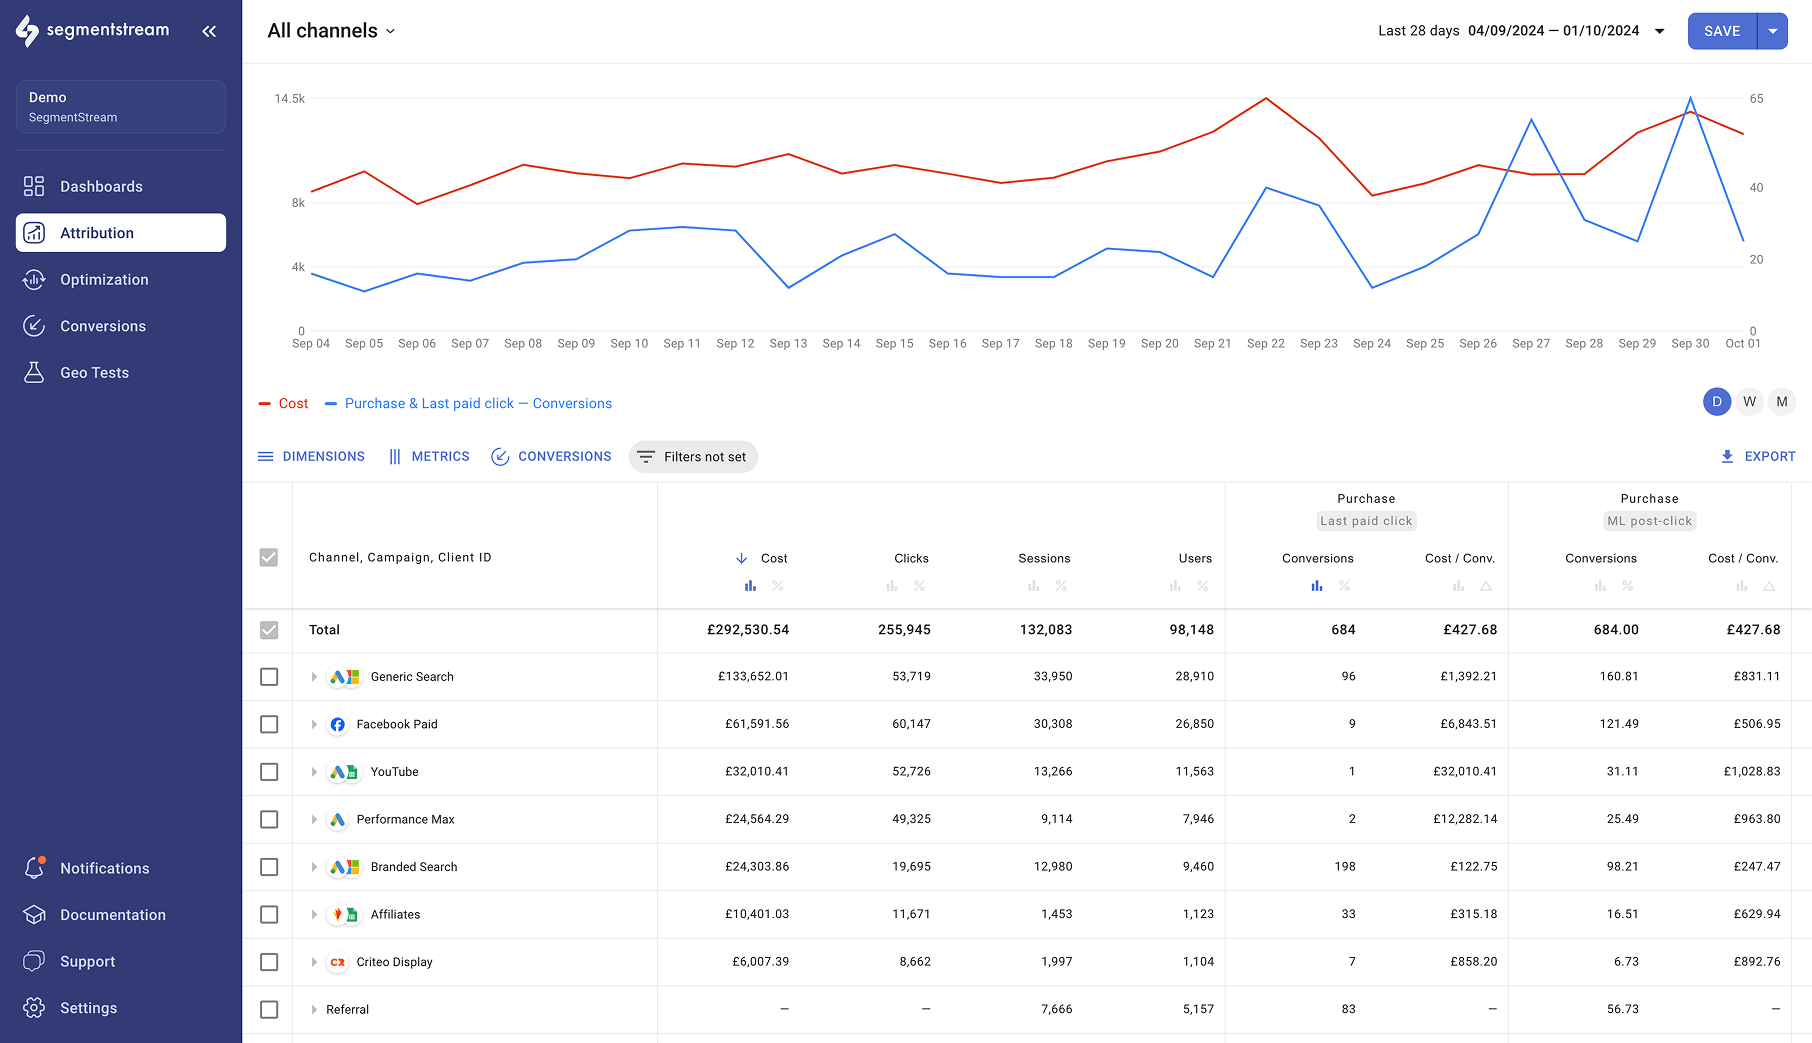
Predictive modeling capabilities enable revenue scenario planning and identification of diminishing returns across channels. These functions are most relevant for teams managing substantial paid media investments.
Server-side tracking and conversion modeling address attribution gaps in privacy-restricted ecosystems. Integrations with advertising platforms, CRM systems, analytics tools, and data warehouses allow the solution to operate within a unified marketing analytics infrastructure.
Commercial terms are structured around monthly digital ad spend and the scope of measurement capabilities required. The pricing request flow groups companies by media budget thresholds, ranging from below €50,000 per month to enterprise-scale investment levels.
This structure reflects alignment with organizations where attribution modeling and incrementality analysis directly influence budget allocation decisions. Licensing expands with integration depth, modeling requirements, and enterprise support.
Engagement terms are defined through consultation.
Pros:
Cons:
SegmentStream aligns with organizations that connect marketing performance to revenue outcomes and operate within complex channel ecosystems. Its feature set corresponds to mid-market and enterprise environments managing substantial paid media investments.

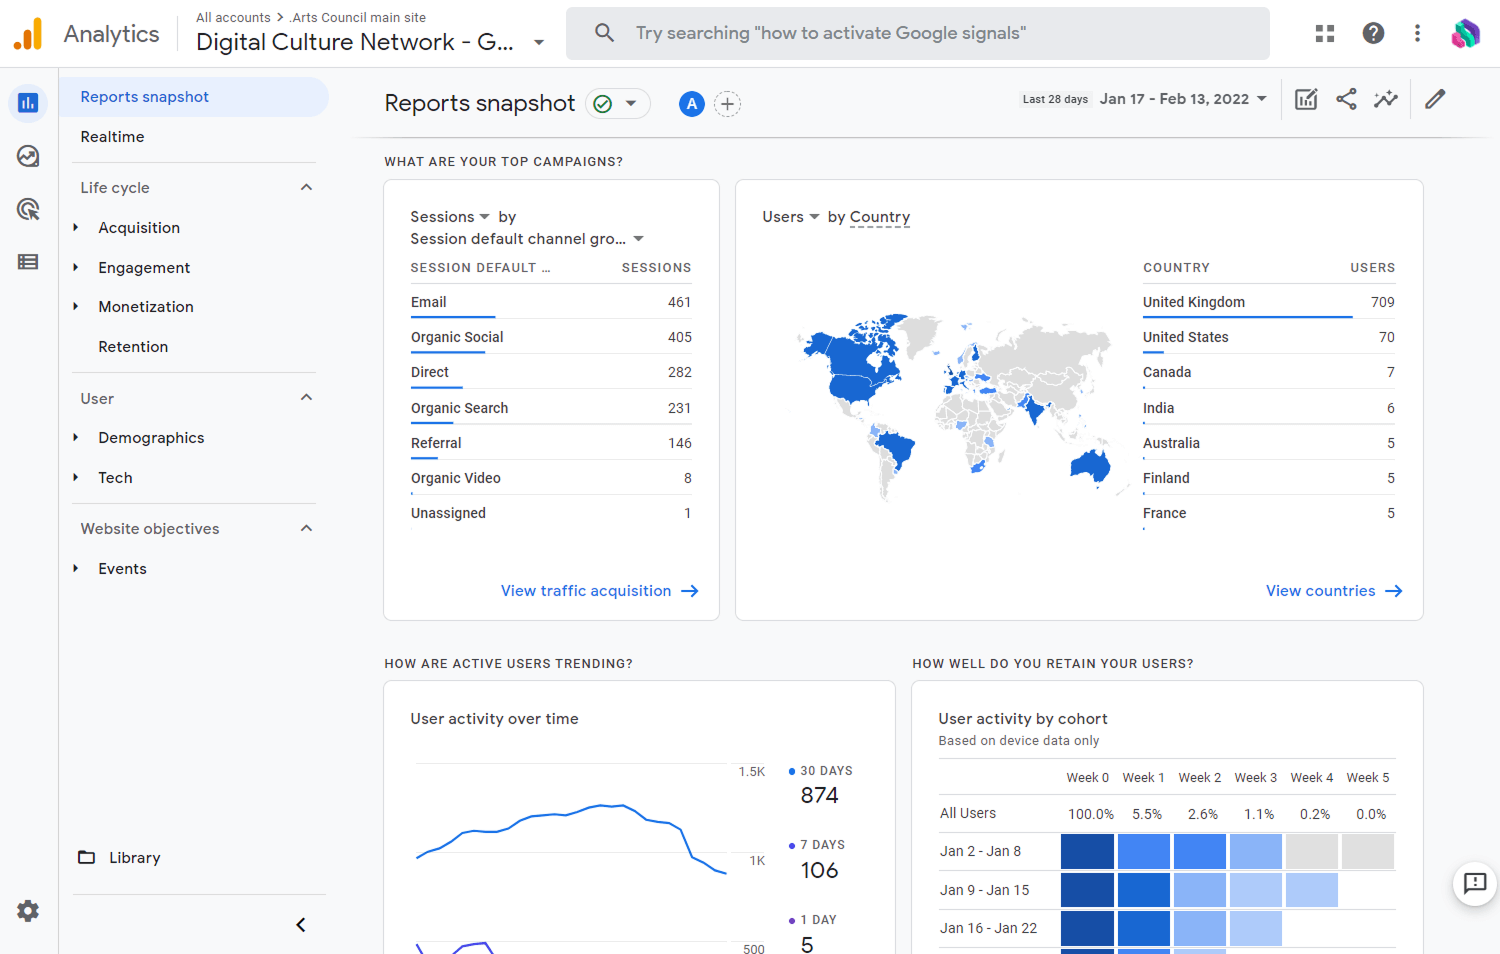
Google Analytics 4 has served as a core measurement layer for digital marketing teams since the transition from Universal Analytics in 2023. The platform introduced an event-based data model that reshaped how user interactions are collected and analyzed.
As emfluence notes: “Analytics in 2026 will be defined by imperfect visibility, smarter modeling, and tighter alignment between marketing performance and revenue.”
The platform uses an event-based tracking structure. Every user interaction, including page views, scroll depth, and clicks, is recorded as an event. This model supports flexible reporting and custom analysis across different behavioral dimensions.
Cross-platform tracking supports collection of website and mobile application interactions within a single property, enabling unified journey analysis across devices.
Predictive capabilities rely on Google’s machine learning models. The system estimates purchase probability, churn likelihood, and projected revenue, allowing teams to build audiences based on modeled behavioral signals.
Privacy controls are embedded within the measurement framework. The platform supports cookieless collection modes, excludes IP address storage, and applies modeled signals where direct identifiers are limited. These mechanisms support compliance with regulations such as the General Data Protection Regulation.
The Exploration workspace enables funnel analysis, path analysis, and segment comparison reporting through a configurable interface.
The standard version of Google Analytics 4 is available at no cost and supports unlimited event collection. Data retention in the free tier is limited to fourteen months, and large historical queries may involve data sampling.
The enterprise version, Google Analytics 360, operates under a commercial licensing model. Public pricing is not disclosed by Google. Market analyses indicate that annual licensing typically begins around fifty thousand US dollars and scales based on data volume and contractual terms.
BigQuery integration is included in the standard version, allowing raw event data exports for advanced analysis and warehouse-based modeling.
Pros:
Cons:
Google Analytics 4 functions as a foundational analytics layer for organizations that require scalable web and application measurement. Its value increases when integrated with structured data warehouses, advertising platforms, and customer relationship management systems.

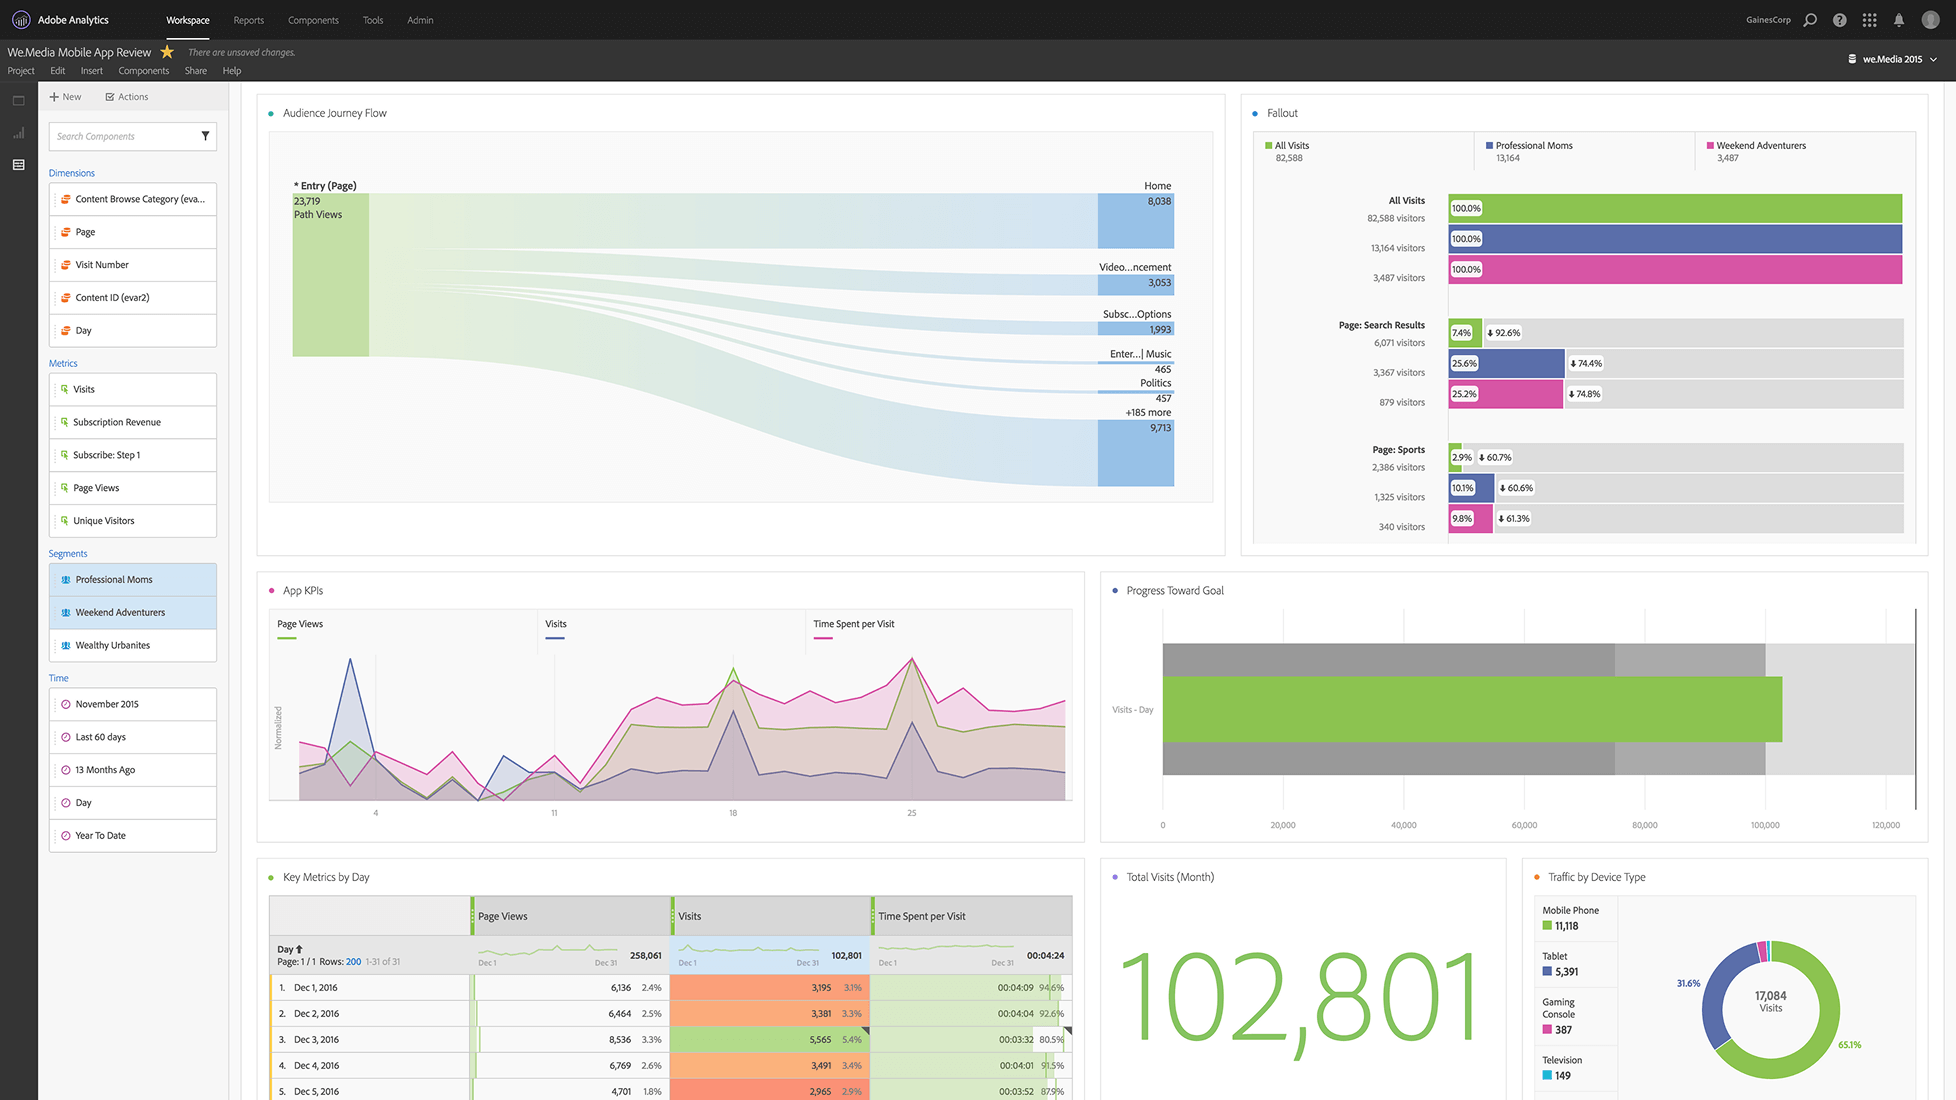
Adobe Analytics functions as an enterprise measurement environment designed for granular behavioral analysis and cross-system data consolidation. The platform supports organizations operating large-scale digital ecosystems with complex segmentation requirements and extended data retention needs.
Analysis Workspace enables fully customizable reporting structures built on flexible dimensions, calculated metrics, and advanced segmentation logic. Reporting frameworks can be adapted to internal governance standards and enterprise KPIs.
Segmentation capabilities allow multi-condition filtering across traffic sources, device categories, behavioral sequences, and transactional thresholds. This supports deep behavioral analysis throughout extended customer journeys.
Integration within Adobe Experience Cloud connects measurement with personalization, content delivery, and campaign orchestration layers. Data flows between products support unified customer profiling and coordinated reporting.
Adobe Analytics operates under an enterprise licensing model. Public pricing is not disclosed on the official website.
Commercial terms are defined through direct consultation and depend on data volume, product tier, and contractual scope.
The platform is offered within the Adobe Experience Cloud framework, where licensing is structured according to enterprise requirements and integration depth.
Pros:
Cons:
Within enterprise infrastructures, the platform operates as a central measurement layer connected to advertising systems, content platforms, and customer relationship management environments. Deployment assumes mature data governance, internal analytical expertise, and coordinated integration between digital properties.

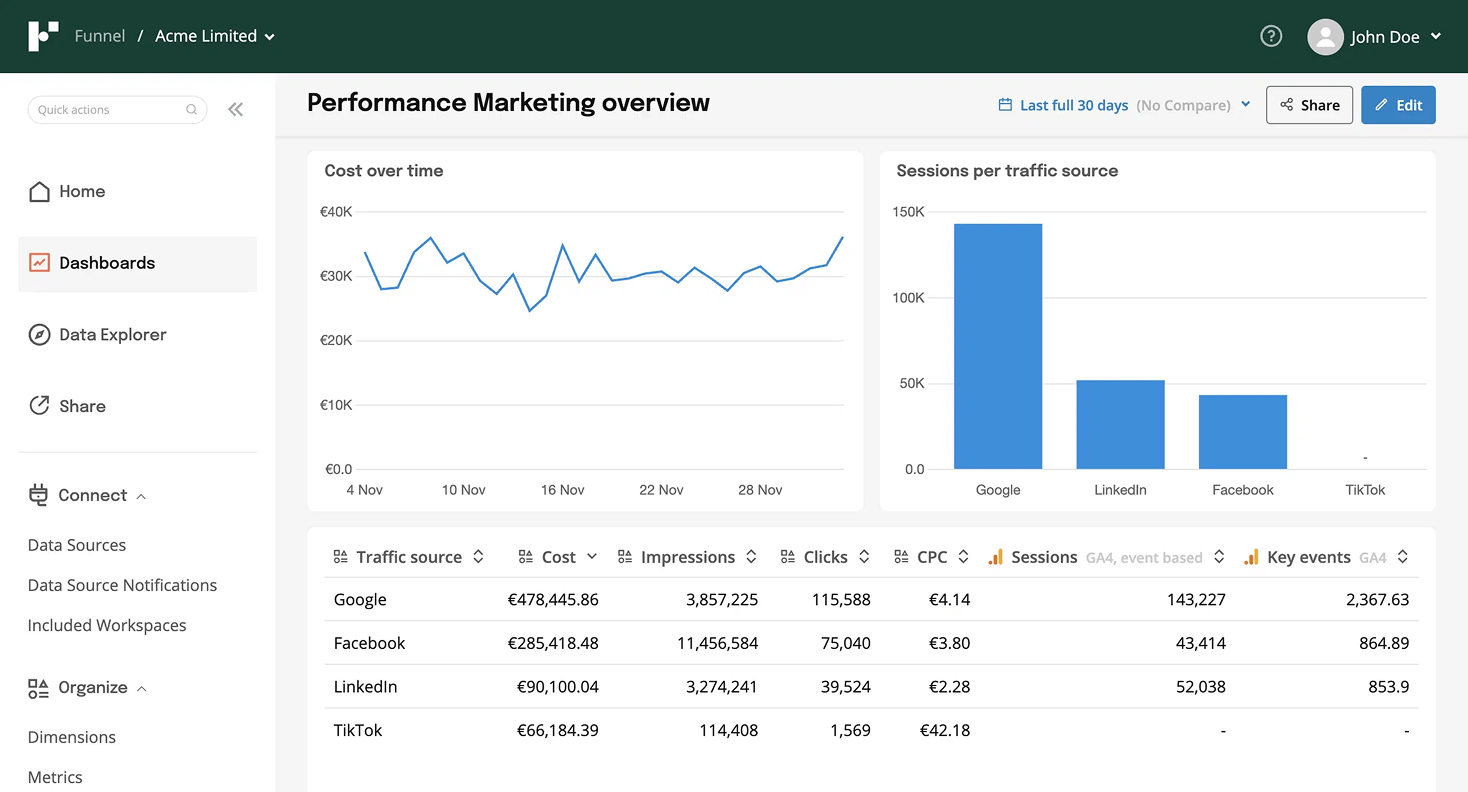
Marketing teams often operate in multiple platforms while performance information remains fragmented. Funnel acts as a central layer that collects and prepares marketing inputs for analysis.
The platform functions as a marketing intelligence environment focused on structured information processing. It connects to more than 500 sources and standardizes inputs before they reach reporting tools or warehouses.
A core strength lies in normalization. Metrics, naming conventions, currencies, and campaign parameters are aligned at ingestion level. This reduces manual reconciliation between platforms such as Meta, Google Ads, and other paid media systems.
The Data Hub operates as the control layer of the architecture. It stores, structures, and governs marketing inputs within a unified repository. From there, datasets can be exported to warehouses, business intelligence tools, or spreadsheets without rebuilding pipelines when APIs change.
Following the acquisition of Adtriba in 2024, the platform expanded into marketing mix modeling and multi-touch attribution. This enables validation of attribution logic on a standardized measurement foundation.
The commercial model is usage-based and built around flexpoints. Cost scales with connected sources, destinations, and transformation complexity.
This structure supports organizations that expand integrations over time. Budget planning depends on the number of active connections and reporting scope.
Pros:
Cons:
Funnel fits organizations that prioritize structured marketing pipelines and centralized governance. It works best in environments where multiple paid media, CRM, and analytics systems need alignment before reporting or modeling layers are applied.

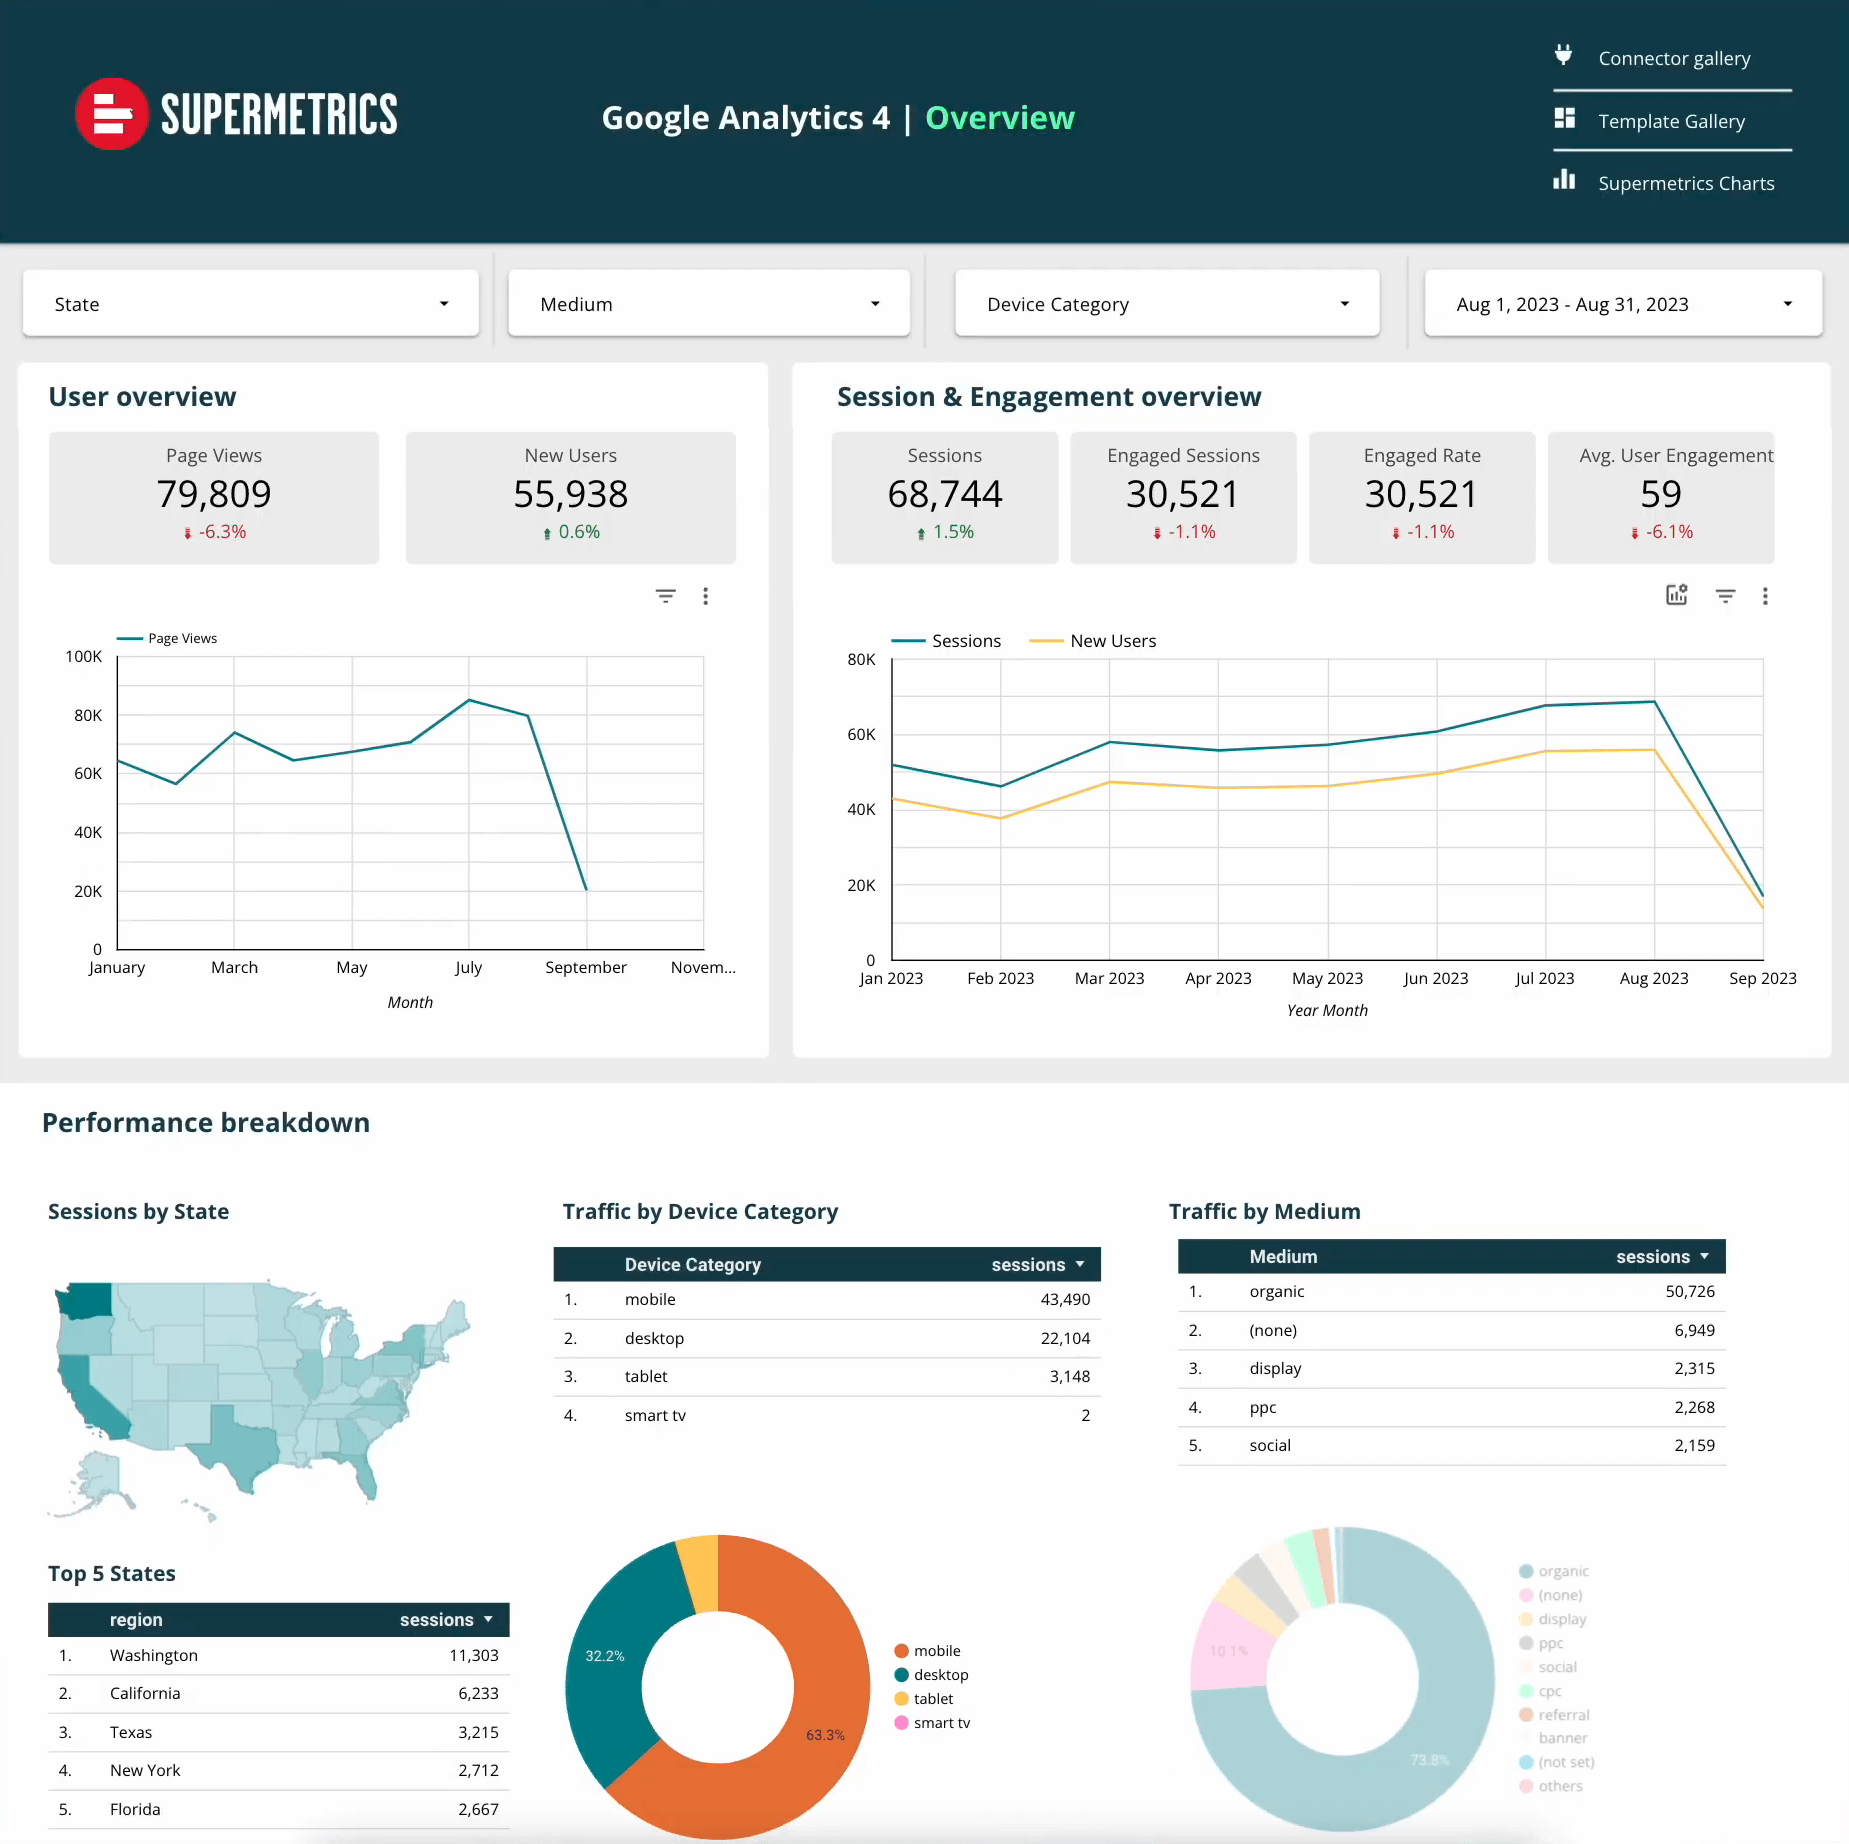
Marketing teams often work in multiple platforms while reporting inputs remain fragmented. Supermetrics functions as a connector layer that moves and prepares marketing inputs for analysis.
The platform connects to more than 138 marketing sources, including Google Ads, Meta, Google Analytics, and specialized ad networks. Information is routed to selected destinations without long-term storage.
Its core capability lies in extraction and normalization. Metrics, naming conventions, currencies, and campaign parameters are aligned at ingestion. This reduces reconciliation work between platforms such as Meta and Google Ads and supports consistent reporting logic.
Instead of providing dashboards, the system delivers structured inputs to external tools such as spreadsheets, business intelligence platforms, or warehouses. Teams define visualization and modeling in their preferred environment.
Transformation rules allow standardization of metrics from multiple platforms, reducing manual preparation work and improving reporting consistency.
Supermetrics offers three main pricing tiers:
Each tier includes a base number of source connectors and one destination. Additional sources and destinations are available for an extra monthly fee. User seats are tier-dependent.
The modular pricing model scales with the number of connectors and export destinations, which should be factored into budgeting for teams with growing integration needs.
Pros:
Cons:
Supermetrics fits organizations that require structured extraction and normalization before reporting or warehouse modeling. It is most effective in environments where multiple advertising platforms feed a centralized reporting or analytics layer.

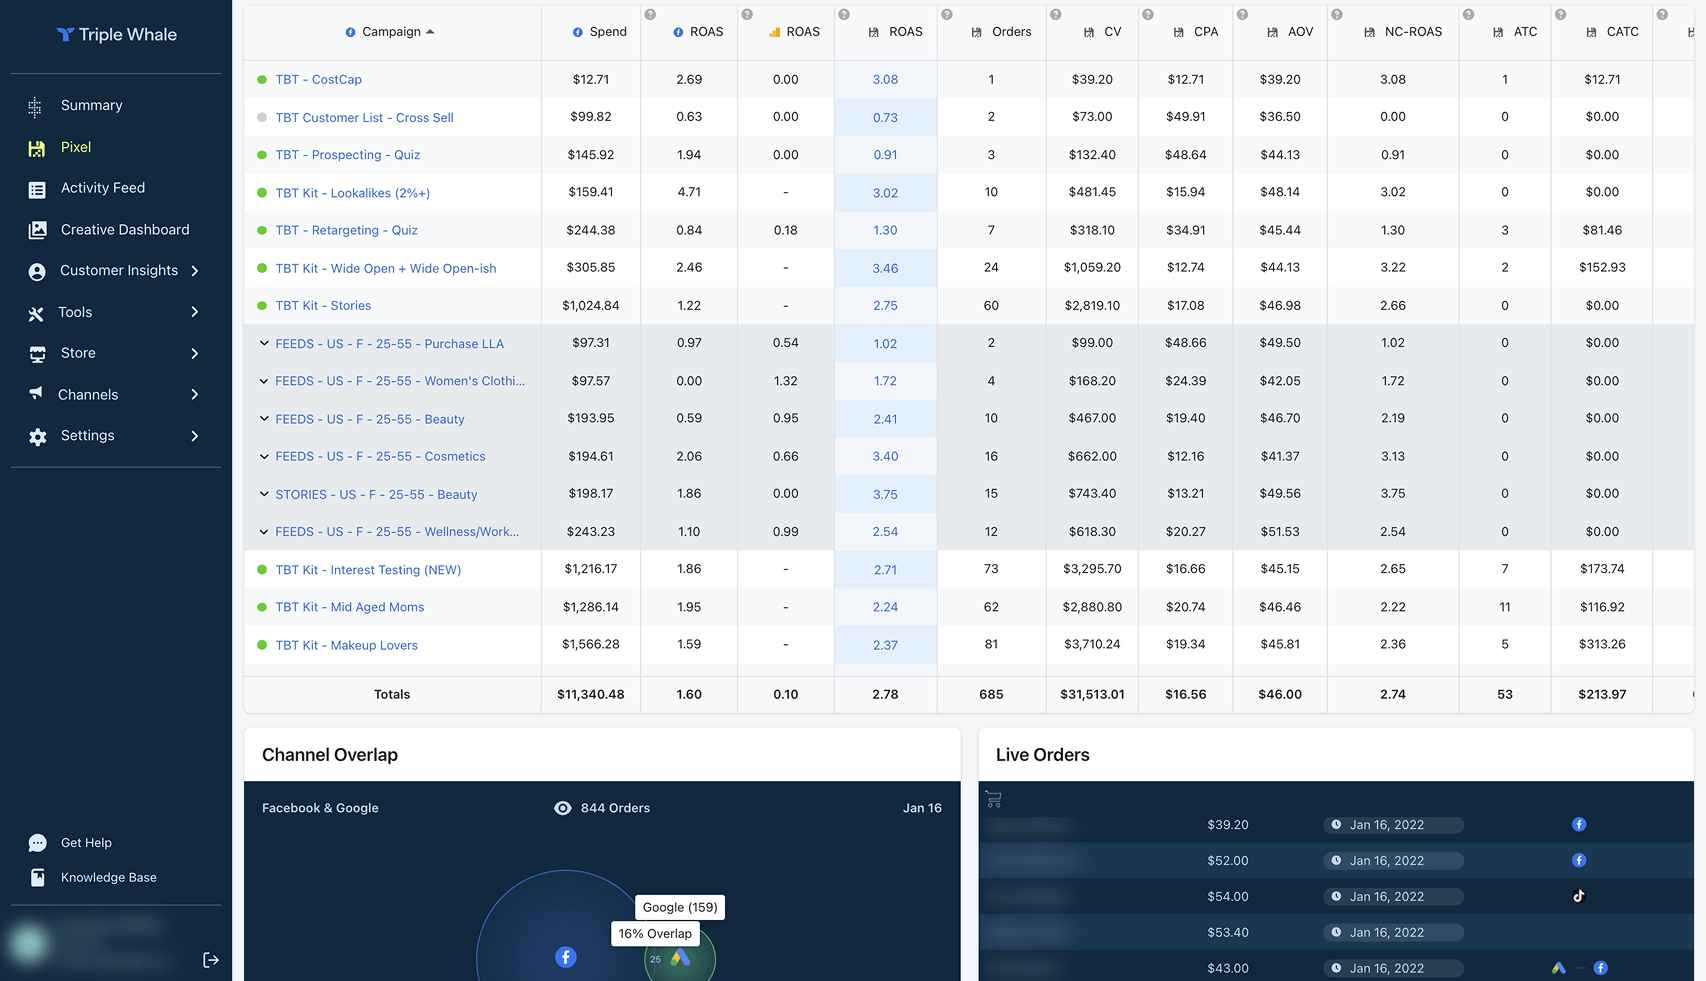
Triple Whale is built for Shopify-based ecommerce brands that require consolidated performance visibility within paid acquisition and creative optimization workflows. It is widely adopted by direct-to-consumer teams managing high-volume media spend and frequent creative testing.
The platform centralizes inputs from more than 50 ecommerce and advertising integrations. Its proprietary pixel is embedded within the Shopify theme and checkout to support multi-touch attribution and transaction tracking.
The Founders Dashboard consolidates inputs from Shopify, Meta, website activity, and email into a single operational interface. This enables smaller teams to monitor acquisition and revenue signals without implementing additional reporting systems.
Creative Cockpit provides asset-level performance analysis, helping teams evaluate ads, creatives, and product combinations. Retention analytics support lifetime value monitoring and cohort analysis. The benchmarking feature compares your metrics against peers across 21 separate categories, providing competitive context within similar business segments.
Triple Whale provides a free Founders Dashboard.
Paid plans follow a revenue-based pricing model. Commercial terms depend on annual store revenue and selected feature packages. Pricing is not presented as fixed public tiers; instead, cost scales according to business size and required functionality.
This structure aligns with Shopify brands whose marketing spend and reporting needs increase alongside store growth. Advanced capabilities such as AI-based recommendations, RFM segmentation, and extended attribution logic are available within higher-tier packages.
Pros:
Cons:
Triple Whale fits Shopify brands operating multi-channel paid acquisition strategies that require structured attribution and creative performance evaluation within ecommerce measurement environments.

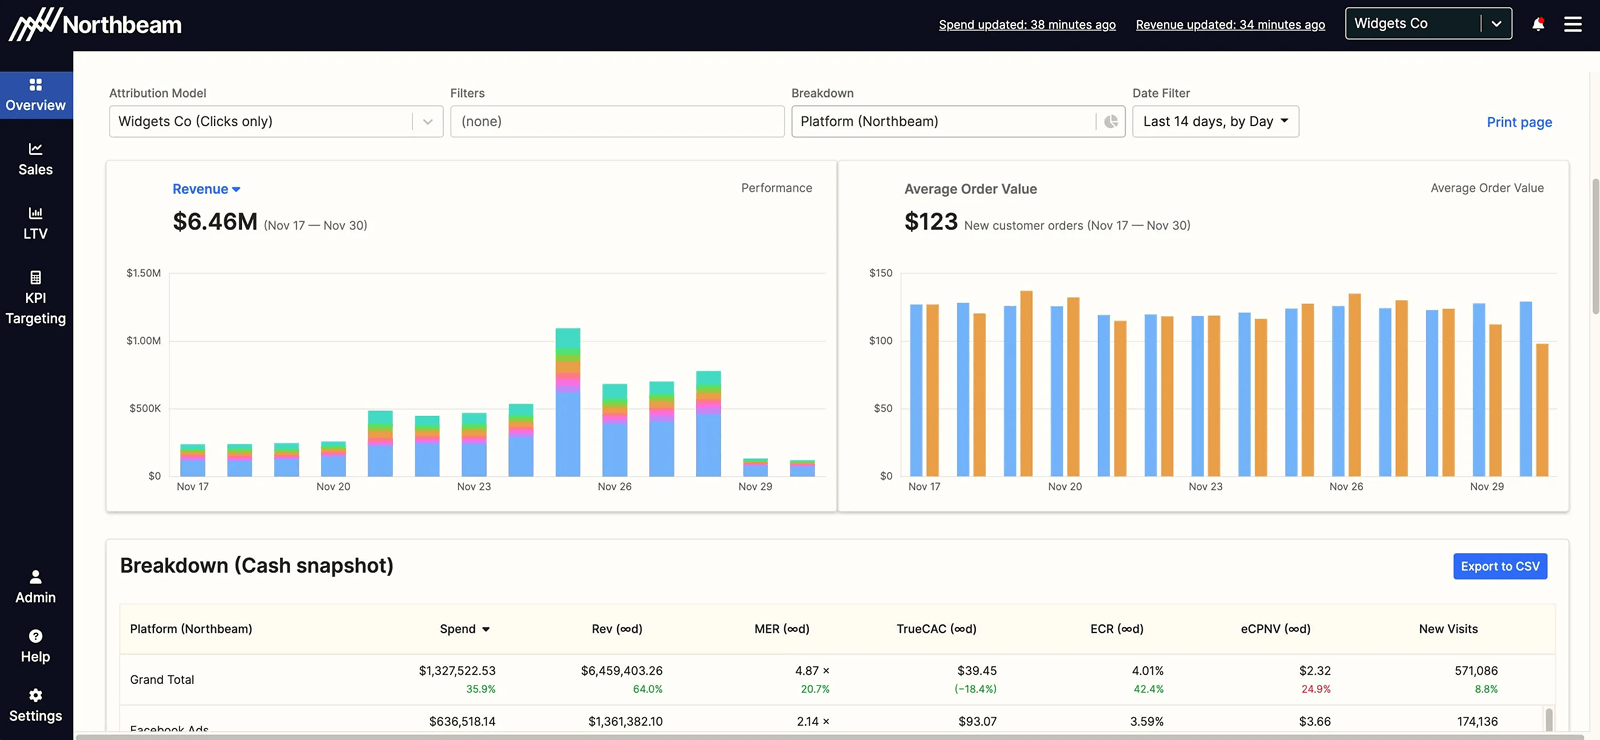
Northbeam operates as a revenue attribution platform designed for ecommerce brands managing substantial advertising budgets. The system applies first-party tracking to connect ad exposure with transaction outcomes.
The platform has gained traction among ecommerce companies looking for alternatives to platform-native attribution models. For brands with substantial ad budgets, visibility into revenue drivers becomes operationally critical.
Northbeam uses a consultative pricing structure aligned with ad spend and measurement scope. The company does not publish fixed public tiers. Pricing depends on media volume, attribution depth, and infrastructure complexity.
This structure aligns with mid-market and enterprise ecommerce brands operating at scale.
Pros:
Cons:
Northbeam fits brands that require profitability-focused measurement and operate with substantial paid media budgets. Adoption assumes structured tracking and sufficient media volume to support modeling.

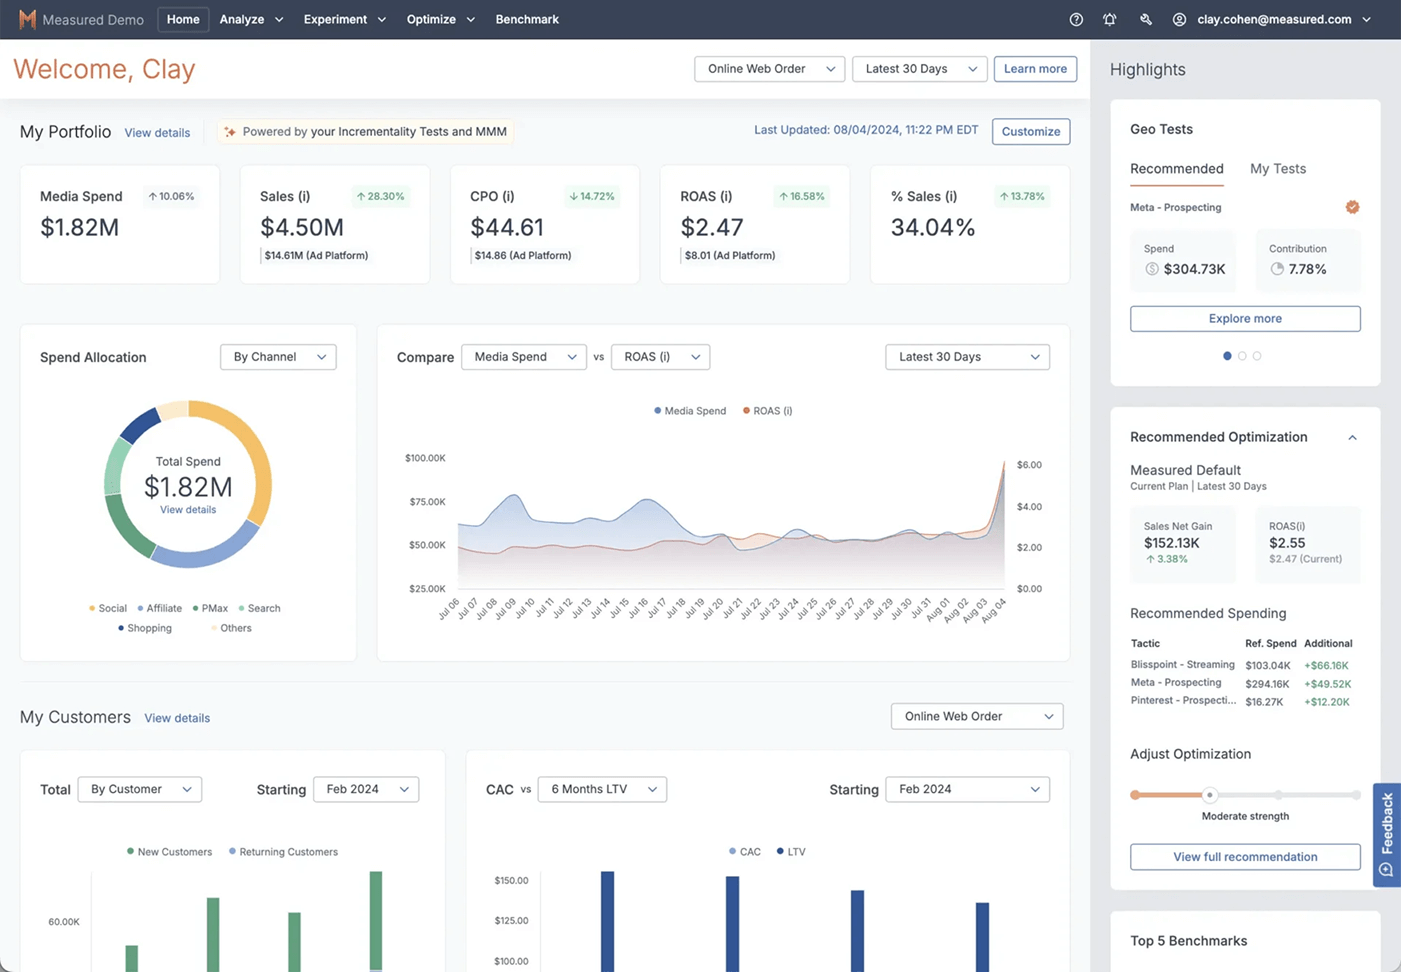
Measured focuses on incrementality-based measurement through controlled experimentation. The platform emphasizes causal impact analysis within paid media environments.
Commercial terms are defined through direct consultation. Public pricing tiers are not displayed on the company website. Licensing depends on modeling scope, experimentation design, and organizational scale.
Pros:
Cons:
Measured fits organizations that require controlled experimentation and structured incrementality validation within paid acquisition programs.
Rockerbox positions itself as a unified marketing analytics environment that brings multi-touch attribution, media mix modeling, and incrementality testing into one operational layer.
The system allows teams to evaluate different approaches within a shared analytical framework, reducing fragmentation between attribution outputs and econometric forecasts.
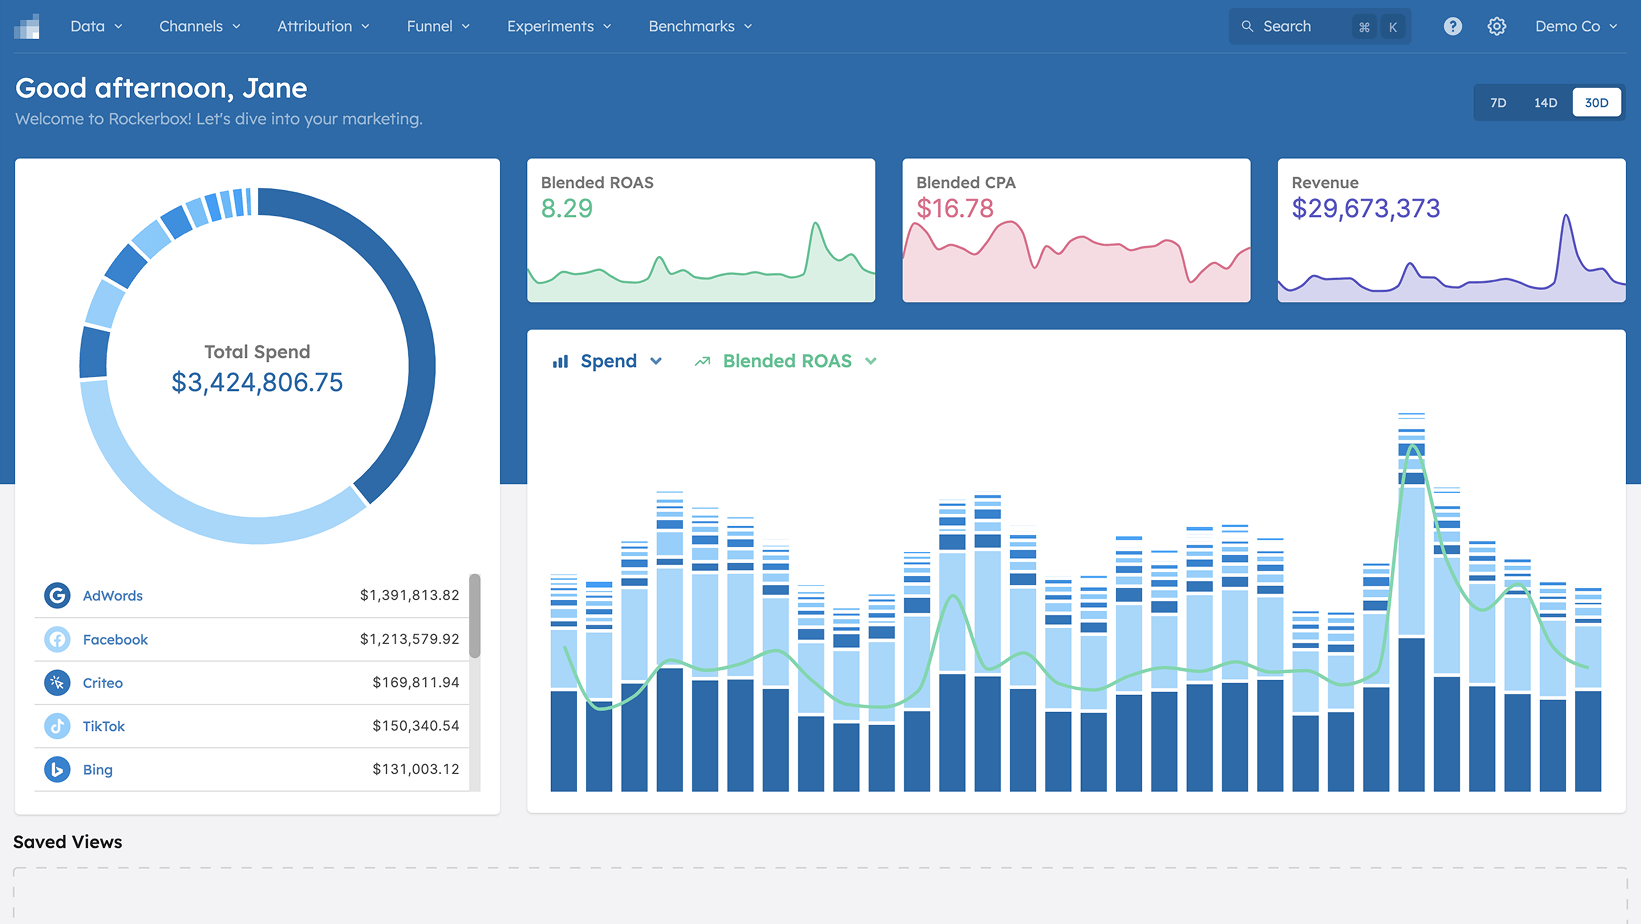
Plans are structured under Starter, Growth, Pro, and Enterprise tiers.
Commercial scope varies based on integration depth, feature access, and support level. Enterprise engagements are defined through consultation and reflect implementation complexity.
Pros:
Cons:
Rockerbox fits organizations managing multi-channel acquisition programs that require coordinated attribution logic, econometric forecasting, and structured experimentation within a unified analytical environment.
No single platform covers attribution, experimentation, integration, and econometric forecasting at enterprise depth.
Some organizations operate with a consolidated analytics layer. Others combine a foundational event tracking system, an attribution engine, and a modeling framework to support capital allocation decisions.
Tool selection depends on reporting maturity, integration architecture, governance capacity, and internal analytical ownership. In advanced environments, measurement functions operate as a coordinated stack rather than a standalone application.
Marketing measurement platforms deliver reliable outputs only when configured within a structured analytics architecture. Attribution logic, event pipelines, CRM alignment, and warehouse synchronization define reporting consistency.
Darwin works with B2B and enterprise teams to align measurement systems with revenue reporting frameworks.
Our work includes:
Projects are structured around reducing reporting discrepancies, improving budget transparency, and establishing governance within marketing measurement environments.
Q1. What are some of the best marketing measurement tools for 2026?
Leading marketing measurement platforms in 2026 include SegmentStream, Google Analytics 4, Adobe Analytics, Funnel, Supermetrics, Triple Whale, Northbeam, Measured, and Rockerbox. These platforms support attribution modeling, incrementality testing, media mix modeling, and structured performance evaluation.
Q2. How does Google Analytics 4 differ from previous versions?
Google Analytics 4 introduced an event-based measurement model and unified web and app tracking within one property. The platform incorporates modeled insights, machine learning–based forecasting, and privacy-aligned tracking logic. It also enables native BigQuery export for advanced warehouse-based analysis.
Q3. What should businesses consider when choosing a marketing measurement tool?
Selection criteria should include attribution logic, modeling methodology, integration depth, reporting flexibility, and governance requirements. Organizations should evaluate whether the platform supports experimentation, budget planning, and alignment between acquisition metrics and revenue outcomes.
Q4. How do marketing measurement platforms address privacy regulations?
Modern measurement systems rely on first-party tracking, server-side event collection, probabilistic modeling techniques, and structured consent handling. Many platforms reduce dependency on third-party cookies and incorporate calibration methods to compensate for signal loss under privacy restrictions.
Q5. What are the benefits of a unified measurement environment?
A unified measurement environment supports consistent attribution logic, consolidated performance reporting, scenario planning, and improved coordination between marketing, analytics, and finance teams. Centralized measurement reduces reporting fragmentation and improves budget allocation discipline.
Contact Darwin today for a custom SEO strategy that combines the best automation tools with proven tactics to dominate Google and AI search results.
Talk to us


.avif)